Comparative Incomes and Politics
The recent report on the global distribution of wealth from the World Institute for Development Economics made news like the report in the Seattle Post Intelligencer:1% owns 40% of world wealth, U.N. says -- Poorest are in Africa, India, part of Asia, study finds
"One percent of the world's adults owns 40 percent of all global assets, according to a United Nations report that describes a growing gap between rich and poor.
"That chunk of the world's wealth is held by the 37 million people with a net worth of $500,000..."
Later today (Dec. 7), the World Bank will release a report on world poverty. These facts, along with those about income distribution, have obvious economic implications and perhaps less-obvious political implications. And this offers the opportunity for comparative studies.
Income distribution in a country is usually described using the GINI index. According to the Wikipedia article, Gini coefficient, "The Gini coefficient is often used to measure income inequality. Here, 0 corresponds to perfect income equality (i.e. everyone has the same income) and 1 corresponds to perfect income inequality (i.e. one person has all the income, while everyone else has zero income)."
Human Development Reports describes the GINI Index this way:
"The Gini index measures the extent to which the distribution of income (or consumption) among individuals or households within a country deviates from a perfectly equal distribution. A Lorenz curve plots the cumulative percentages of total income received against the cumulative number of recipients, starting with the poorest individual or household. The Gini index measures the area between the Lorenz curve and a hypothetical line of absolute equality, expressed as a percentage of the maximum area under the line. A value of 0 represents perfect equality, a value of 100 perfect inequality."
A more thorough explanation of the mathematics behind GINI index (and there will probably be some of your students who will want and can understand this) can be found at the web site of the Japan Seaology Promotion Organization.
If you're as hazy in your understanding of the math as I am, you might want to offer this information to the math wizards in your class before you discuss or assign something about this topic and recruit them to help you explain the numbers behind the measurement.
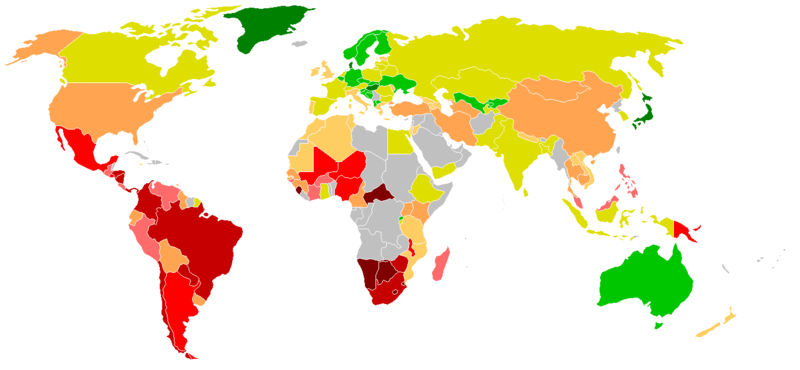
This map from Wikipedia illustrates the GINI indicies for countries around the globe.

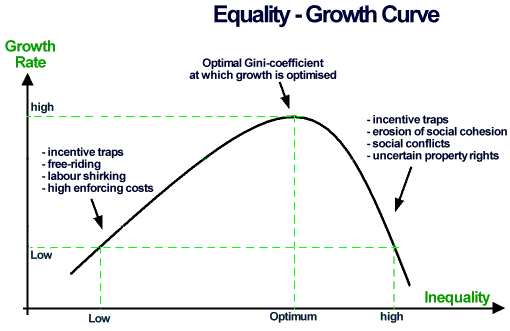
So, what does are the political implications of income distribution? Giovanni Cornia and Julius Court write in Policy Brief No. 4: Inequality, Growth and Poverty in the Era of Liberalization and Globalization for the World Institute for Development Economics Research (WIDER) at The United Nations University:
"High inequality has been shown to limit progress in education and accumulation of human capital. It also reduces progress in fertility control. There may also be implications through political channels leading to policy choices that are sub-optimal. Inequality in a democracy can lead to populist measures with negative implications for economic efficiency, macroeconomic stability and growth.
"Finally, high levels of income inequality... can also create political instability and social problems and affect very negatively growth over both the short and long term... Previous... research suggests that high horizontal inequality [between groups within a society] increases the risk of social tensions and conflict..."
Cornia and Court's thesis is illustrated by this chart:
Teaching ideas:
Ask your students to make a couple hypotheses about income distribution, on one hand, and education, human capital [productive skills and abilities], political and/or social stability, or social tensions and conflict on the other. Then ask them what evidence (for the countries they are studying) they would look for to support or contradict their hypotheses. Then "send them out" to find data.
You could give them two assignments
- find data to support their own hypotheses
- find data to contradict someone else's hypothesis
Human Development Reports has a list of countries and their GINI Index ratings as does the CIA World Factbook
- The CIA World Factbook also has a lot of demographic data your students could mine.
- Global Security has information on wars and "international disputes."
- Boston University's Political Stability chart ranks nations according to their levels of stability
- World Resources Institute offers information on "Political Stability and Absence of Violence"
- Freedom House offers reports on individual freedoms
- Transparency International offers information on the political effects of corruption
- The World Bank's Worldwide Governance Indicators
offer information on a variety of political and economic factors - The Economist offers a 2005 'quality of life' index for 111 countries
And you probably know of other good sources which you can point your students to.
posted by Ken Wedding @ 9:05 AM
![]()
![]()


0 Comments:
Post a Comment
<< Home